Blog

When HR leaders talk about making the business case for better hiring, the conversation usually stalls in one of two places. Either the numbers feel too speculative to present with confidence, or the analysis is so detailed that no one in the room has the patience for it.
What's missing is a practical, repeatable framework for translating screening quality into financial terms — one that's rigorous enough to be credible and simple enough to be usable in a budget conversation.
This piece gives you that framework. You'll be able to calculate the cost of your current screening outcomes, model the financial impact of specific improvements, and build a scenario analysis your CFO and CEO can engage with.
The Core Equation
The financial impact of screening quality rests on four variables:
1. Annual hire volume (H) — How many external hires does your organization make in a year?
2. First-year failure rate (F) — What percentage of those hires underperform significantly or leave within their first 18 months? This includes both voluntary and involuntary separations, plus hires who remain but are being managed for performance. A widely cited study by Leadership IQ — based on 5,247 hiring managers and more than 20,000 new hires — found the failure rate to be 46%, a figure that has been consistently echoed across multiple independent studies over the past two decades.
3. Average fully-loaded compensation (C) — The annual salary plus benefits, payroll taxes, and equity for the average role being filled. For a $75,000 base salary role, fully-loaded compensation typically runs $90,000–$105,000 depending on benefits structure.
4. Cost multiplier (M) — The cost of a bad hire as a multiple of annual fully-loaded compensation. Research puts this range at 50%–200%, depending on role seniority, specialization, and the cost of disruption to the team. Use 50% for junior/high-volume roles, 100% for mid-level professional roles, and 150%–200% for senior, technical, or client-facing roles.
The annual cost of bad hires:
Annual Cost = H × F × C × M
Running the Numbers: Scenarios by Company Size
The following scenarios use an average fully-loaded compensation of $95,000 and a mid-level cost multiplier of 100% (one times annual salary). Adjust inputs for your organization.
Scenario 1: 25 hires per year
At the 46% failure rate:
Bad hires per year: 11.5
Annual cost: 11.5 × $95,000 × 1.0 = $1,092,500
At a 25% failure rate (below-average, well-run recruiting function):
Bad hires per year: 6.25
Annual cost: 6.25 × $95,000 × 1.0 = $593,750
Scenario 2: 50 hires per year
At the 46% failure rate:
Annual cost: $2,185,000
At a 25% failure rate:
Annual cost: $1,187,500
Scenario 3: 100 hires per year
At the 46% failure rate:
Annual cost: $4,370,000
At a 25% failure rate:
Annual cost: $2,375,000
These are conservative estimates. They use the midpoint cost multiplier. Senior or technical roles where the multiplier reaches 150%–200% will produce significantly higher numbers.
Calculating the ROI of a Specific Improvement
The more actionable version of this analysis is not "what is our current cost?" but "what is the return on reducing our failure rate by X percentage points?"
The improvement formula:
Annual Savings = H × ΔF × C × M
Where ΔF is the change in failure rate (expressed as a decimal).
Example: A 50-hire-per-year company at a 40% failure rate, average fully-loaded comp of $95,000, mid-level multiplier of 1.0x.
A 10-point improvement (40% → 30%): 50 × 0.10 × $95,000 × 1.0 = $475,000/year
A 15-point improvement (40% → 25%): 50 × 0.15 × $95,000 × 1.0 = $712,500/year
A 20-point improvement (40% → 20%): 50 × 0.20 × $95,000 × 1.0 = $950,000/year
Now compare those savings figures to the cost of the intervention — whether that's a new screening platform, competency assessment tools, recruiter training, or an external consultant engagement. In most cases, a 10-point improvement in first-year failure rate produces savings that dwarf the investment required to achieve it.
Adjusting for Role Mix
Real recruiting functions aren't uniform. A company making 50 hires per year might be filling 30 entry-level roles, 15 mid-level roles, and 5 senior roles — each with different compensation and different cost multipliers.
A more precise model segments by role tier:
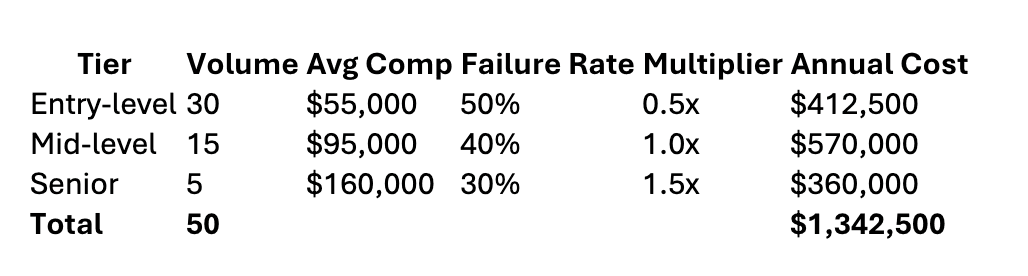
This segmented view is more credible in a CFO conversation than an aggregate estimate, and it usually produces higher numbers — because senior role failures, even at lower rates, carry disproportionate financial weight.
Beyond Direct Replacement Costs
The formulas above capture direct costs: recruiting spend, onboarding investment, and the cost of replacement. They don't capture several significant indirect costs that are harder to quantify but very real:
Manager time. A struggling new hire absorbs an outsized share of their manager's time and attention. Conservative estimates put this at 10–20% of a manager's productive capacity during the first 90 days of a performance-managed situation. For a manager earning $120,000, that's $12,000–$24,000 in productive capacity diverted to salvage work — per bad hire.
Team disruption. Research on team productivity consistently finds that a single underperforming team member reduces overall team output. Quantifying this is difficult, but acknowledging it in a leadership conversation adds credibility to your analysis.
Opportunity cost. Every month a role is filled with the wrong person is a month it isn't filled with the right one. For revenue-generating roles, that gap is directly measurable in quota attainment. For operational roles, it shows up as delayed projects and absorbed capacity.
When you add these indirect costs, the true cost of screening failures is typically 30–50% higher than the direct replacement cost calculation suggests.
Presenting the Analysis to Leadership
A few principles for making this analysis land in a business conversation:
Use your own numbers, not industry averages. Pull your actual first-year attrition data. Segment by hire source, role level, and recruiter if you can. Leadership will engage more with "our first-year failure rate is 38% for externally hired individual contributors" than with "the industry average is 46%."
Show a range, not a point estimate. Present the cost at your current failure rate alongside the cost at a 10-point and 20-point improvement. The comparison is more compelling than any single number.
Anchor to something leadership already cares about. If there's been a recent conversation about revenue productivity, connect your screening ROI analysis to ramp time and quota attainment. If the conversation has been about manager effectiveness, connect it to the time managers spend managing struggling new hires. Find the thread that's already in the room and pull it.
Be honest about the confidence interval. Don't claim precision you don't have. Presenting a range — "we estimate annual screening failures cost between $800,000 and $1.6 million" — is more credible than a single figure, and demonstrates the kind of analytical integrity that builds trust.
The Benchmark That Reframes the Conversation
For most mid-market talent acquisition functions, the annual savings from a 10-point improvement in first-year retention exceeds the total annual cost of running the recruiting team — salaries, tools, job advertising, and all.
That reframe matters. It moves the conversation from "what does recruiting cost?" to "what does recruiting produce?" And it positions investment in screening quality not as a cost-center line item but as one of the highest-return investments a growing company can make.
Want to run this analysis with your own numbers? Download CLARA's Quality of Hire ROI Calculator — a pre-built model that lets you input your hire volume, compensation mix, and current failure rate to generate a customized business case. Available at getclara.io.